


Overview
Since November 2014 we have been implementing a Data Lake platform to collect, process, filter, enrich, store, analyse and visualize logs and business events using Big Data and streaming technologies. The main goal is to detect important events, generate statistics and produce alerts to solve problems in a proactive way.
Our first pilot on a new customer is usually related to application logs but once this platform is up and running it naturally becomes the centralized repository not only for logs but also for any type of sources and data formats. With dashboards on display in big screens other areas and departments start requesting dashboards of their own that require new data sources to be connected.
To adapt to different use cases and new requirements we needed a more modular, flexible and extensible architecture. As the Data Lake gained prominence within our firsts customers and other project opportunities materialized, challenges and constraints emerged that led us to rethink our initial architecture.
Challenges
Technical issues are not the only constraints in software architecture design. Even when they are the most important, business restrictions are highly influential too:
-
Data democratization
We were struggling to keep up with all the data reports and visualizations. We needed a way to allow non-specialists to have the ability to gather and analyze data without requiring help from our team.
-
Data visualization and data-driven decision making
We were part of meetings where people were making decisions based on intuition or using reports outdated by days, weeks or even months. We needed a platform to allow non-specialists to make ad-hoc reports on easily accessible, accurate and up to date data.
-
Skill gap between ideal position requirements and market availability
It was really hard for our local partners to find qualified employees to work in our area. The solution at hand was to hire junior engineers right after their graduation to help in active projects. This increased our need for easy to use tools that allowed new employees to be productive from day one.
-
Public procurement cycle
The way projects are structured in the public sector makes it common for us to do 3 to 6 month projects to solve particular problems and then have to wait for months until the next stage is approved for us to go back. The gaps in our presence require the end user to be able to inspect, troubleshoot and make small modifications to running systems without requiring deep technical skills. Our integration and visualization tools should make it easy for them to create new dashboards or modify existing ones.
-
Reduce manual work on deployment process
We relied on scripts to automate most tasks but we needed a platform to minimize the manual work. We required a tool to centralize the creation, validation, testing, building and deployment of pipelines in order to eliminate the intermediate steps between our workstations and the integrations running on production.
-
Data Integration and data visualization as a new commodity
When we started in 2014, having a centralized Data Lake where our customers could make ad-hoc queries, live dashboards and mapreduce jobs was enough to win projects. After a few months that became a commodity, a starting point.
Most dashboards, including the data integrations were required to be live the next morning. We were working in environments with one urgency after another. We needed tools to create new integrations and consume, parse, store and visualize data as soon as possible.
-
Monitor data integration pipelines and troubleshoot with clarity
Both in development as in production we needed tools that allowed anyone to find the cause of issues as quickly and as easily as possible, this activity is easier to achieve if live data is available for inspection. We had tools that were efficient and performant but when there was a problem it was really hard to find the cause. Rebuilding and redeploying jobs in multiple nodes made the process slow and tedious.
-
Live and interactive demos
We started giving many presentations and pre-sales talks. Our audience wanted to see live demos of real projects. We needed something more attractive than config files, bash scripts and a lot of JSON.
Solution
Since we started with Big Data in November 2014 until we built the new architecture in January 2017, we analyzed and tested multiple tools both in development and production and it was StreamSets that excelled above all of them and continues to do so to this day.
StreamSets Data Collector gave us the leap in quality we needed and responded to many of the challenges we had. We shortened our time to production by days, thanks to its user-friendly UI, visual approach and drag-and-drop capabilities.
Streamsets has prebuilt and reusable components that empower non-technical business users to build end-to-end data transformations and visualizations without the need to write a single line of code. The inclusion of non-technical users in the data lake construction process eliminated the need to hire expensive, specialized developers and promoted data democratization and data driven decisions.
Streamsets solved our problem with the public procurement cycle. Now the end user was able to inspect, troubleshoot and make small modifications to running pipelines and dashboards.
Unlike other low-code tools with rigid templates that limit what you can build and customization is restricted, StreamSets has components that allow you to go low level and even extend the platform when needed.
We have a deep belief that in order to make a long-term commitment to a tool it is very important to trust not only the latest version of the product but also the team and company behind it. As a product development company we have experience inferring if a product aligns with our vision of what a Big Data solution should be. We have a series of defined steps when analyzing any product:
-
Implement a real use case end-to-end to validate features but also to have an end user experience
-
Analyze the development team checking their public code repositories, the clarity of the commits logs, number of collaborators and level of activity
-
Issue tracker responses
-
Release notes to have an idea of the product’s evolution
-
How easy it is to extend, build, test, deploy and integrate
-
Community commitment, reviews, blogs, forums and responses in stackoverflow
-
Vision from founders and investors
The feedback we received from the Big Data team confirms that it is the right tool for data ingestion. We have a flexible architecture that allows interchangeability of components and it is the team that pushes to use StreamSets when there are other alternatives to consider. The team was happy to work with a tool that gives them solutions without struggling with it.
The main highlights from our team when comparing it to other tools:
-
Quick and easy troubleshooting during development and in production
-
Detailed logging shows you what’s happening
-
Snapshots and previews
-
Handles increasing data volume and number of pipelines with ease
-
Fast data drift adaptation
-
Supports structured and unstructured data
-
Variety of sources, processors, sinks and formats and how easy is to extend the tool when some component is not available
-
No downtimes for maintenance thanks to pipeline replication
-
Early warnings, threshold rules and alarms
-
Detailed metrics and observability
-
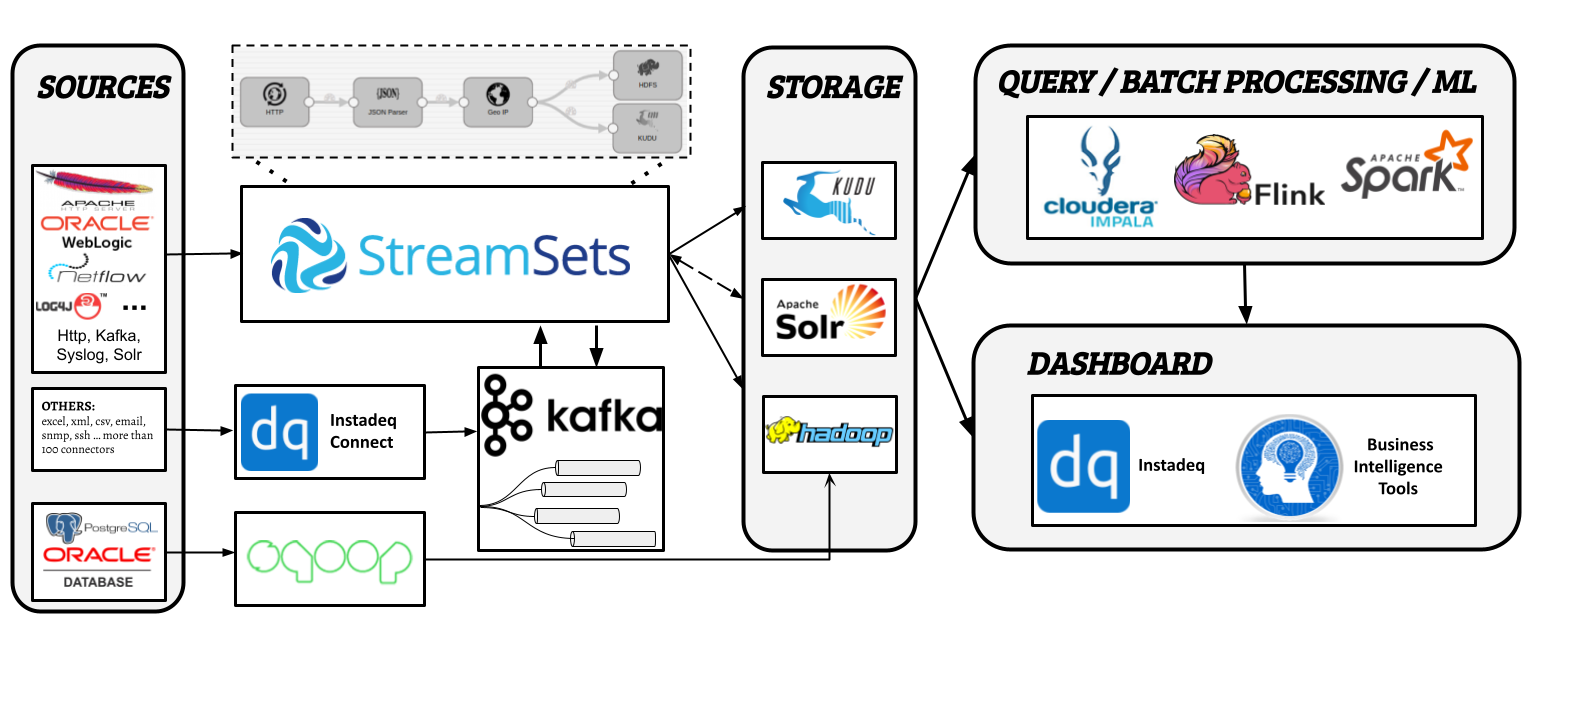
Great integration with the rest of the architecture components such as Kafka, HDFS, Solr and Instadeq
The last big surprise we had was how StreamSets improved our pre-sale presentations. Being a clear and visual tool, it allowed us to make demos where managers could understand what they were going to find at the end of the project. StreamSets and Instadeq allowed us to have functional, clear and highly visual demos. Something that’s not possible with other ETL tools or frameworks like Spark and Flink.
With our continuous and expanding use of StreamSets as our data integration component we started formalizing some emerging patterns that allowed us to simplify maintenance, avoid downtimes and take advantage of the use of Kafka, HAproxy and pipeline replication to scale integrations with large data volumes or complex transformations. Our StreamSets Data Integration Patterns post contains a list of our most used patterns.
Success Stories
We had great success with this platform with our first customer in 2015 and this allowed us to get new prospects mainly in Government Agencies. Our list of implementations and pilots includes:
-
Ministry of Employment and Social Security
Logs centralization and fraud detection jobs around social security pensions and other social programmes. Acknowledgments and articles in technology magazines:
-
Winner of Fujitsu SELECT Innovation Award 2017.
-
Exame Informática 245, Magazine Edition from November 2015
-
Ministry of Health
Part of the Data Lake and Instadeq dashboards were used by the Covid Task Force to take decisions and monitor covid cases, the Vaccination Programme and EU Digital COVID Certificates. We also provided internal tools built with Instadeq that allowed the Vaccination Centers and doctors to consult information about patients, vaccines and certificates.
-
Central Bank
Aggregation and visualization of logs from Windows Servers, Event Tracing for Windows (ETW), Internet Information Server (IIS) and .NET applications.
-
Ministry of Education
Fraud detection jobs on sick leaves and school resources management.
-
Telecommunications Services Company
Monitorization and incident response for their Data Center consuming signals from routers, switches and Uninterruptible Power Supply (UPS) units.
-
One of the largest media and retail companies in the country
The pilot mainly focused on implementing Machine Learning on infrastructure logs on Supermarket’s Christmas marketing campaigns.
Javier Dall’ Amore
Co-founder at Instadeq, Inc.
javier@instadeq.com