


G1GC: Garbage 1st Garbage Collection:
Utilizing the G1GC algorithm for the JVM can be extremely helpful in more efficiently managing garbage collection in larger heap size environments. This is especially the case for those attempting to leverage max heap sizes ~6GB or larger as is recommended[4] . G1GC more effectively handles larger heap sizes while minimizing the GC collection latency. This is accomplished through a couple of different methods: defining regions, compacting, and pause prediction. In short, G1GC will divide the memory into regions which are then prioritized for allocation and garbage collection.
GC.log Troubleshooting:
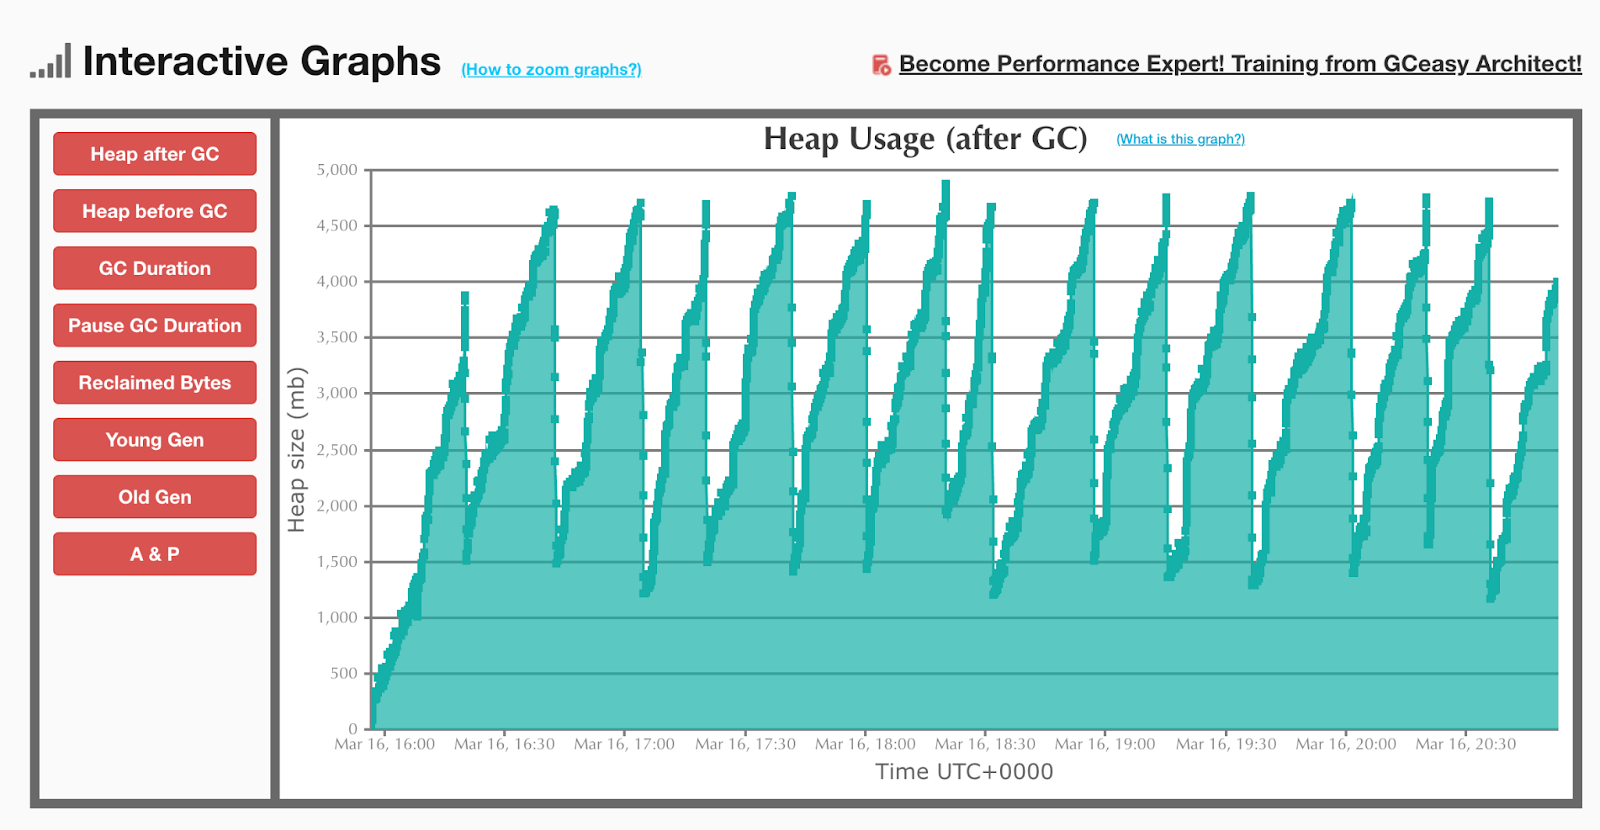
When troubleshooting Data Collector and Control Hub memory issues one of the best places to check first is to examine garbage collection health. Garbage collection logging is defined within sdc-env.sh and can be enabled by adding to SDC_JAVA_OPTS with the flag -XX:+PrintGC. Additionally the logs can be located by default under $SDC_HOME/log/. The following visualizations illustrate an instance allocated for a heap size in the recommended usage range for G1GC. The images detail the before and after changes from CMS to G1GC.
This graph showcases an example of poor garbage collection health prior to the transition to G1GC. Here the red triangles indicate a full garbage collection cycle has taken place, yet heap usage doesn’t drop off afterwards. This is the result of there being more application traffic and object generation which garbage collection was unable to sustain. Due to the high level of computational need for full garbage collection cycles, patterns such as this will result in a spike in CPU utilization as well.

Conversely, this graph showcases an example of healthy garbage collection activity after the switch to G1GC. This is most easily and simply understood from the consistent rising and falling peaks denoting the freeing of memory. This is the result of successful garbage collection cycles which G1GC handles as mixed cycle collection. This is a combination of the young and old generation being cleaned up[3]. You may also notice that the heap is not completely going all the way down. This is because G1GC attempts to avoid a full garbage collection at all costs to minimize large pause times or stop-the-world events.
JVM Memory:
JVM memory usage is broken down into 4 values init, used, committed, and max. For the purpose of this discussion we will just be focusing on used and committed, but information regarding the others can be referenced[4]. Used memory is the actual amount of memory which the JVM is actively utilizing. While committed memory is the memory which has been allocated to the JVM. This means that you could have 10 GB of committed memory allocated to the JVM, but only 2 GB is actively being used. It is important to understand this fact about committed memory as that is what will be represented from the OS perspective.
This means that when running information gathering commands such as “top” or “ps aux” the memory value associated with the JVM process will represent the value for the committed memory. In the example below the SDC process is associated with PID 38355.
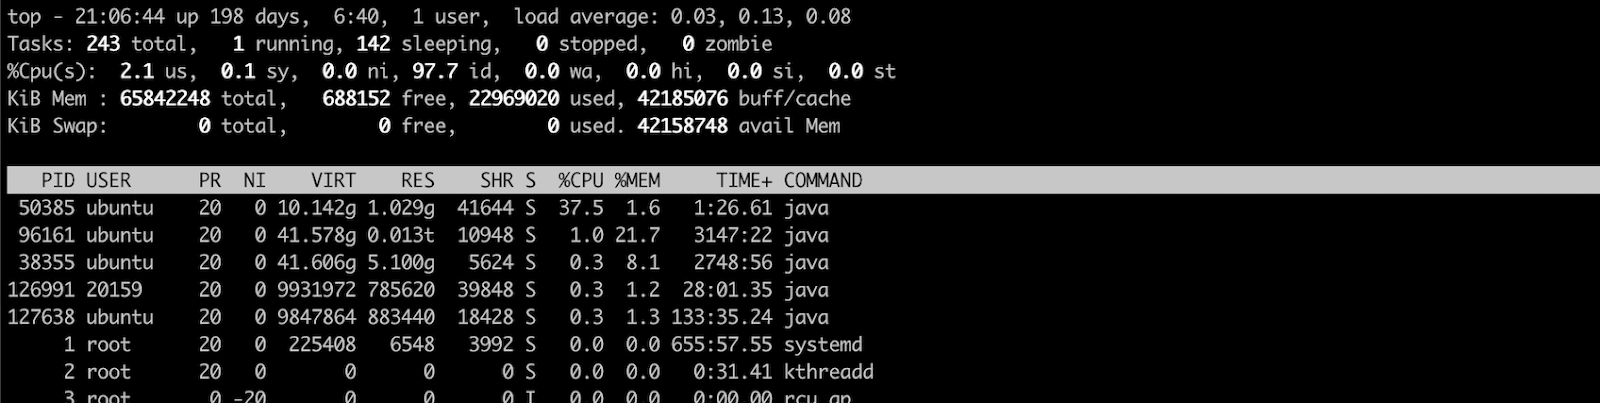
However, the actual breakdown of memory utilization of this process can be better understood by leveraging tools in jcmd. JCMD can provide a very wide array of diagnostic tools, but for the purpose here we just want to use “jcmd <PID> GC.heap_info”. This will allow us the actual representation of the used versus committed memory being used by the JVM.
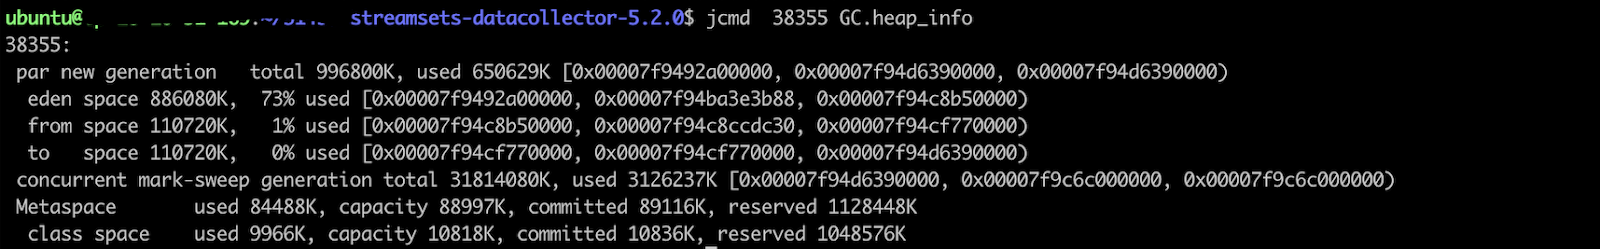
Understanding and identifying this information will give insight into whether or not the JVM process is truly holding onto memory and not relinquishing it back to the OS.
Scenario:
For example, say you had a server with 12 GB of RAM and a max heap size of 9 GB. You noticed that memory utilization on the server was at ~80% utilization. Running the top and jcmd from above you realize that not only does the OS level specify high utilization, but also that the JVM is using ~ 9 GB “used” of that memory. Periods of sustained activity such as this past ~5 seconds and greater would then be cause for alarm. However, say your investigation found that used memory only accounted for 1 - 2 GB from the 9 GB max heap. In a case such as this there is less call for concern, though this may be an opportunity to reevaluate how you configured your heap sizes or provisioned the server.
References:
1 Garbage Collection Analysis
https://blog.gceasy.io/2021/10/15/interesting-garbage-collection-patterns/
2 G1GC Bug
https://bugs.java.com/bugdatabase/view_bug?bug_id=6490394
3 G1GC
4 Memory Usage
https://docs.oracle.com/javase/8/docs/api/java/lang/management/MemoryUsage.html
5 Memory Release
https://openjdk.org/jeps/346
6. JCMD
https://docs.oracle.com/javase/8/docs/technotes/guides/troubleshoot/tooldescr006.html