


Overview
Cluster Mode pipelines operate differently than standalone pipelines. Because they run on clusters either as MapReduce or Spark applications, each Worker Data Collector has its own log. Information regarding the pipeline is not logged to the master/gateway Data Collector's sdc.log file.
Cluster Batch Pipelines (HDFS Origin):
Cluster Batch pipelines run as MapReduce jobs in YARN. At the time of writing these are pipelines that use the HDFS Origin. We'll describe multiple ways to gather the appropriate logs.
Via Command Line
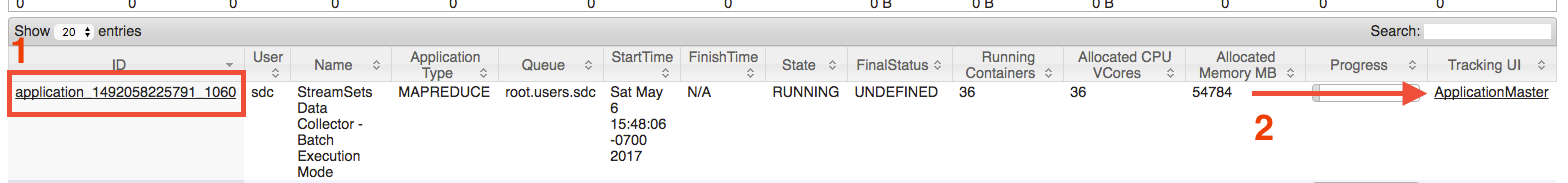
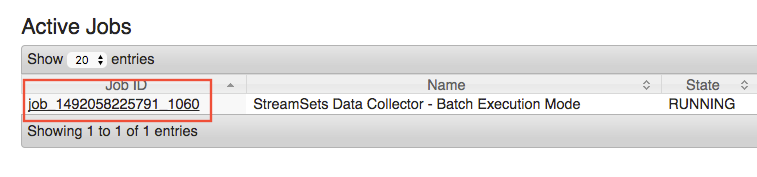
First, find the application ID for the SDC Pipeline:
$ yarn application -list
Total number of applications (application-types: [] and states: [SUBMITTED, ACCEPTED, RUNNING]):1
Application-Id Application-Name Application-Type User...
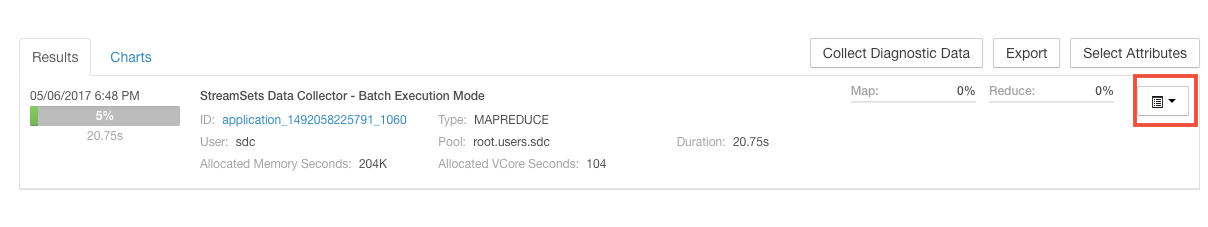
application_1492058225791_1060 StreamSets Data Collector - Batch Execution Mode...Tip: You can also pipe the output to grep to reduce the number of results to only batch pipelines from Data Collector. e.g.
yarn application -list | grep 'Batch Execution Mode'NOTE: To confirm the application-id of the job you can go to SDC pipeline--> pipeline history in monitor panel.
Next, you fetch the aggregated logs and pipe them to a single file:
yarn logs -applicationId <applicationId> >> aggregated_logs.txtSubstitute <applicationId> for the value found in the first command. In this example it would be 'application_1492058225791_1060'.
NOTE: You need to run the YARN command as an SDC user.
If you are not able to get the logs as an SDC user due to some permission, you can run the following two commands, which will create a fake bash:
sudo chsh -s /bin/bash sdc
sudo su sdc
Then you will be able to get the YARN logs by running the following command (mentioned also above):
yarn logs -applicationId <application_Id> >> aggregated_logs.txt
Via YARN Resource Manager UI
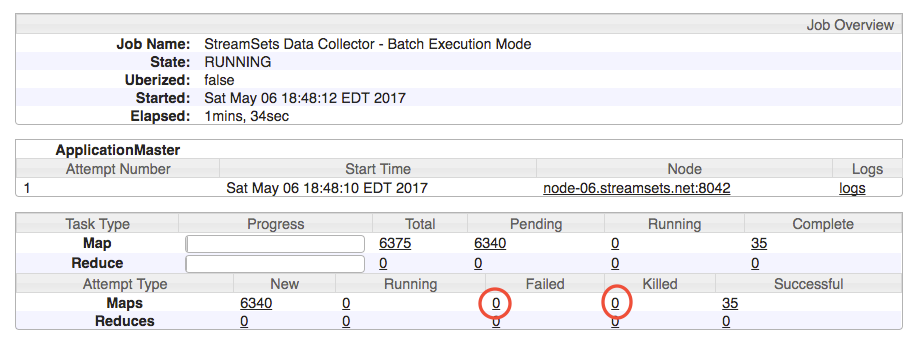
Navigate to your cluster's YARN Resource Manager UI and click on Applications in the navigation sidebar on the left. Find the corresponding YARN application for your pipeline and click on the Application Master link on the far right side.
Depending on whether or not the pipeline is currently running (shown below) or if it has finished the next page may look slightly different. Please click on the job link as shown below or another link that lets you drill down to the screen that shows MapReduce Tasks.
The screen below will show running, failed, killed, or successful tasks. Each of these tasks represents a worker data collector. In the example below, by the time the pipeline has finished, it will have spawned a total of 6375 ephemeral data collector workers. For the purposes of troubleshooting, we are interested in Failed or Killed tasks. To see the individual logs for each task (SDC worker) click on the link represented by the numbers in the table as shown below.
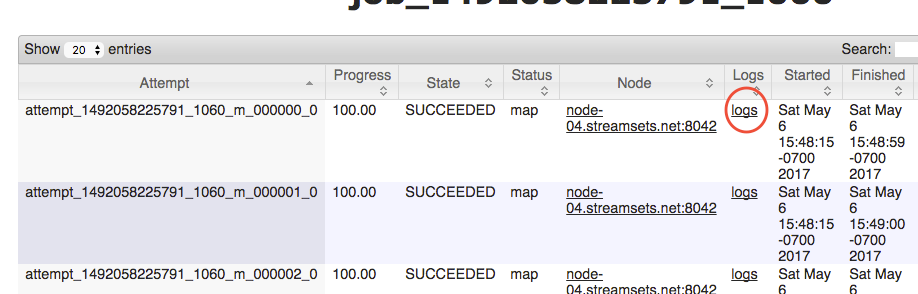
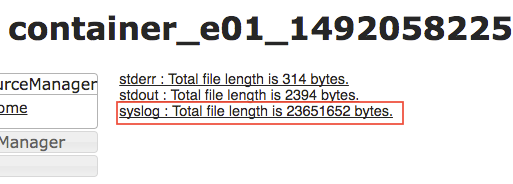
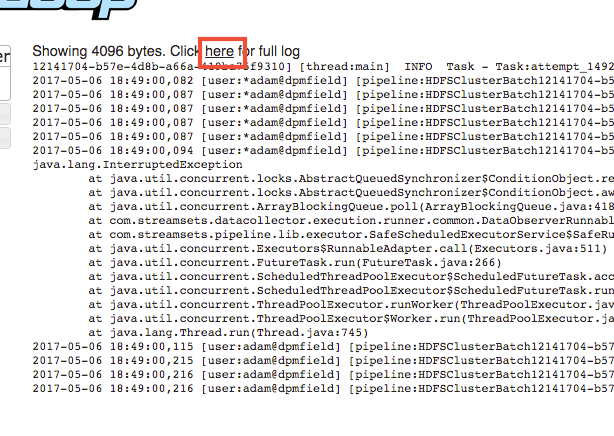
Now click through the links in the order shown below. The last one will display the full log file. You can also right-click it and choose "Download Link As..." to save the file to your computer.
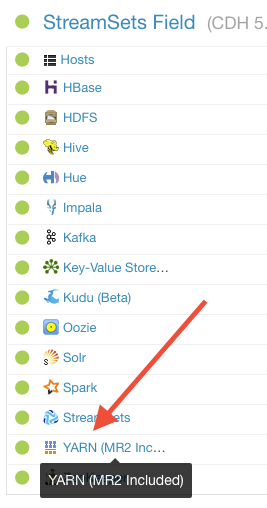
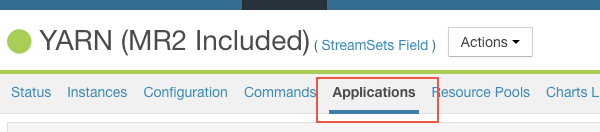
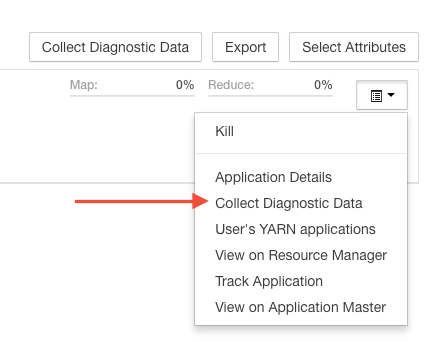
Via Cloudera Manager
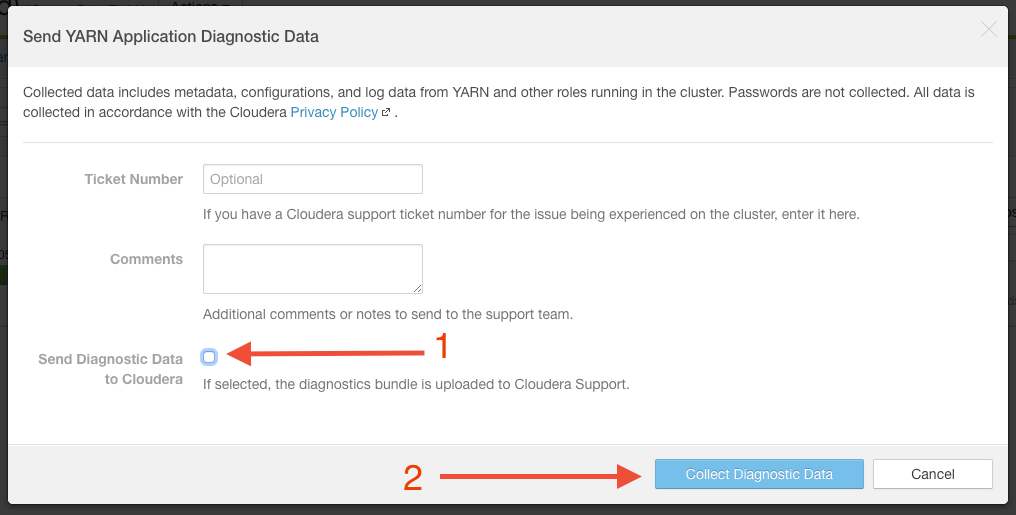
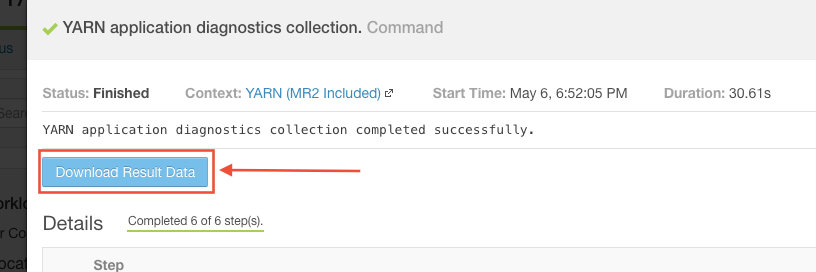
If you have access to Cloudera Manager, you can also create a diagnostic support bundle for any YARN application by following the steps outlined below. Please make sure to uncheck the box that says "submit to Cloudera" to avoid sending the bundle to Cloudera. The last step includes downloading the support bundle (a zip file). This zip file can be provided to StreamSets support and will contain all the necessary logs and information about your environment.