Hi,
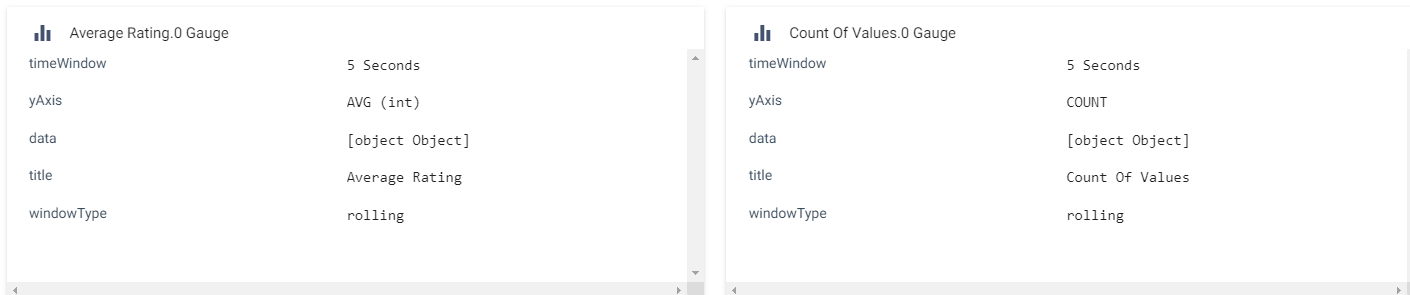
I have a pipeline which is using windowing aggregator to perform couple of window aggregations. When I run the pipeline, I don’t see the chart generated but instead I see the below. Am I missing something?
Regards,
Karthik

Hi,
I have a pipeline which is using windowing aggregator to perform couple of window aggregations. When I run the pipeline, I don’t see the chart generated but instead I see the below. Am I missing something?
Regards,
Karthik
This chart was missing, but should now be visible as of the most recent release.
Enter your E-mail address. We'll send you an e-mail with instructions to reset your password.