How to troubleshoot: JDBC Lookup Performance Issues
When facing performance issues within the JDBC Lookup stage there are a variety of different variables which may cause or contribute to the issue. Provided below are some initial techniques which you can add to your tool belt to assist you in diagnosing this issue.
* To note, while this article is targeted specifically for diagnosing JDBC Lookup issues the same principles of steps 1 & 2 can be used towards JDBC Query Consumers.
Step 1: Enabling DEBUG Logging
Enabling DEBUG can often provide a lot of the information you need to determine a next action for investigation. It can provide additional context to error messages which you may have observed previously, but it may also show errors which were previously not available. Additionally, it can also provide information which - while not an obvious error - can provide crucial insight into the pipeline operation such as statistical data.
Debug can be configured in Data Collector via the following:
Navigate to the impacted pipeline -> select Logs -> select Log Config, and you should now see the configuration detailed below.
By default loggers 1 - 4 will already be specified, any subsequent additions should be made via the following format:
logger.<l[4>]>.name = <class name>
logger.<l[4>]>.level = DEBUG
For example in this scenario:
logger.l5.name = com.streamsets.pipeline.stage.origin.jdbc
logger.l5.level = DEBUG
logger.l6.name = com.streamsets.pipeline.stage.processor.jdbclookup.JdbcLookupLoader
logger.l6.level = DEBUG
logger.7.name = com.streamsets.pipeline.stage.processor.jdbclookup.JdbcLookupProcessor
logger.l7.level = DEBUG
Step 2: Review & Calculate

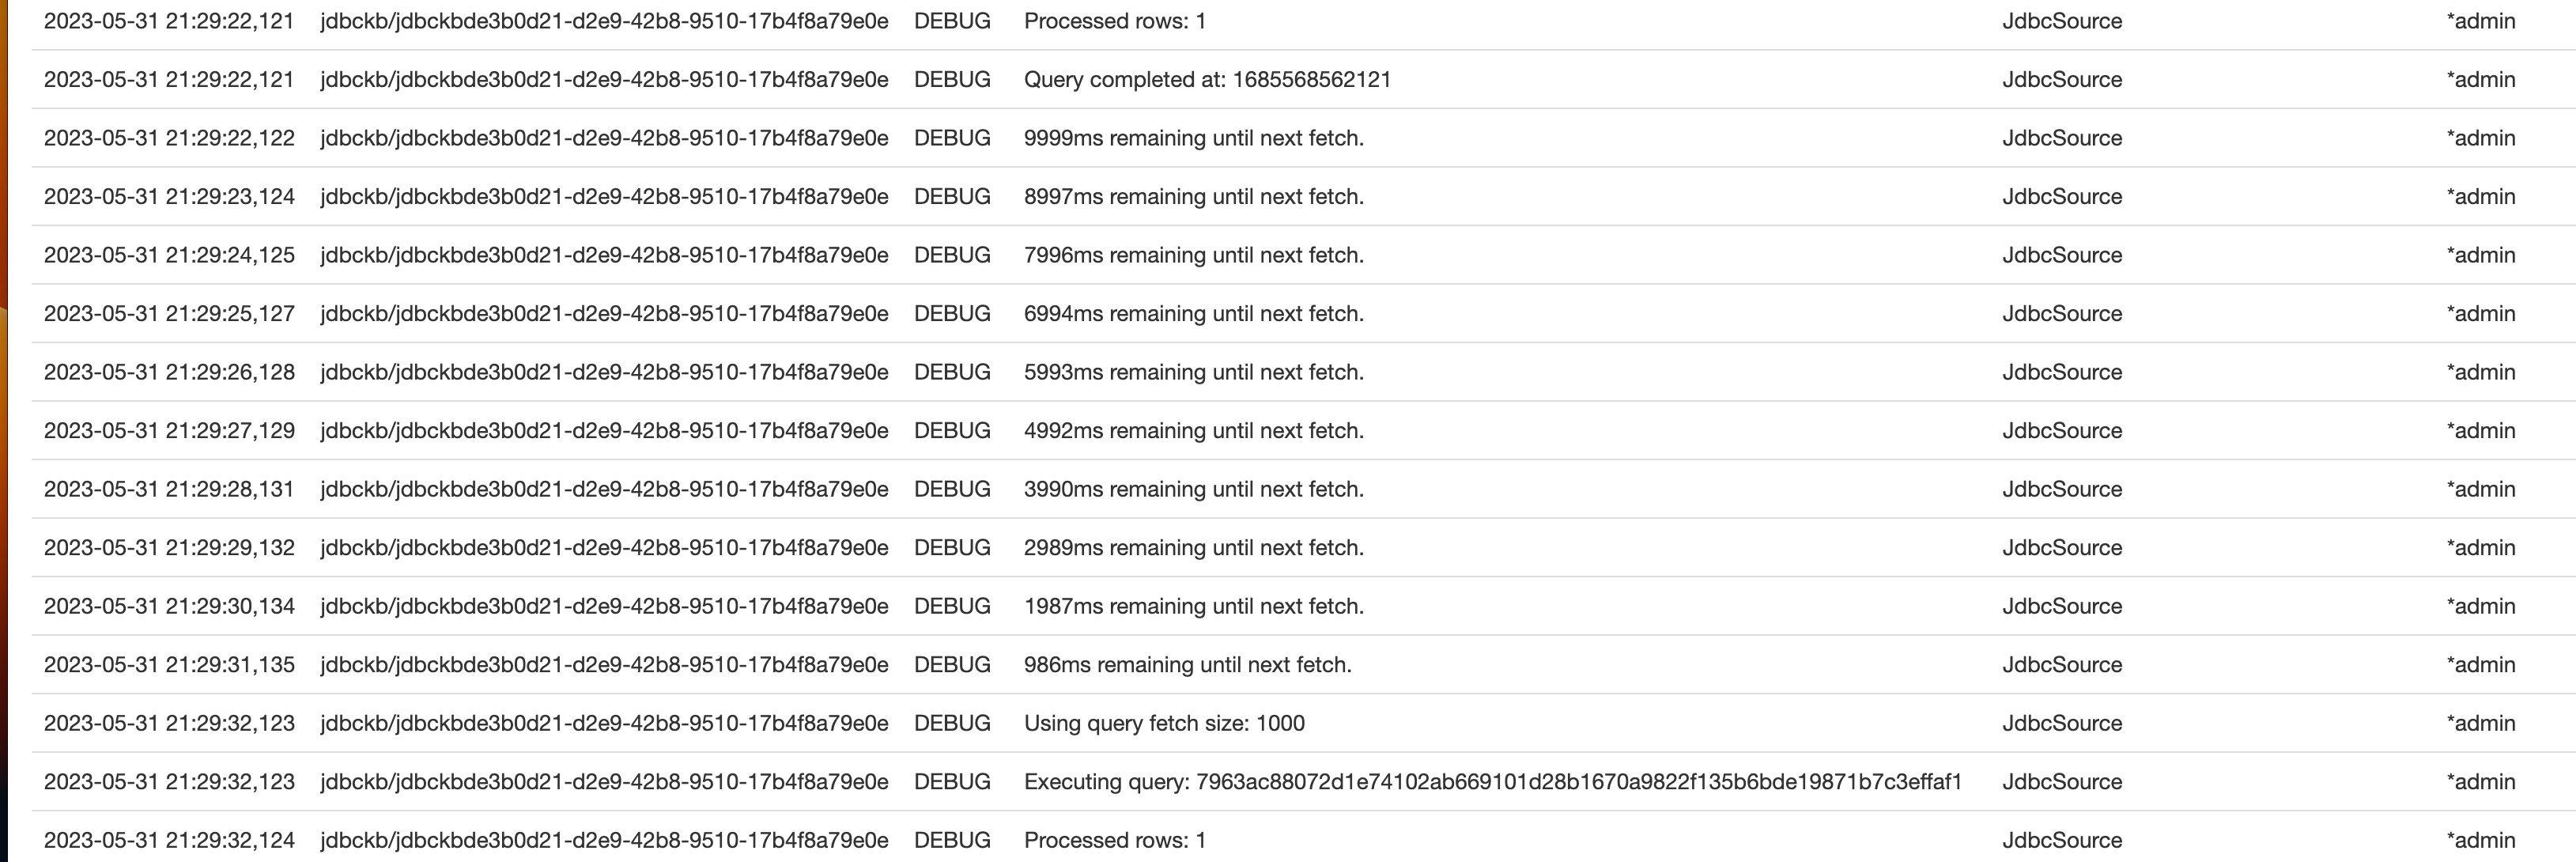
Depicted above is an example log stream after implementing the previously state log changes. When analyzing performance of JDBC queries and lookups it is important to reflect on the following:
How large are the records I am trying to retrieve?
How many records am I attempting to process in a batch?
How long is a transaction taking to process?
In the example shown above we can see that a transaction is taking roughly 2 milliseconds to complete. If we understand our data, given its size, scope, timing, and configurations we can then calculate out what we should expect for it to process.
For example:
If we have 10,000 records to process, and each record takes 2 milliseconds then:
(10,000 * 2) / 1000 = 20 seconds of total processing time.
If instead we have 1123 records to process, and each record takes 2 - 3 seconds then:
(1123 * 3) / 60 ~ 56 minutes of total processing time.
Step 3: Summary & Mitigation Steps
It is important to note that there are methods within Data Collector which can help to mitigate these potential performance impacts.
On the JDBC Lookup stage select the JDBC tab
Navigate down and ensure that Enable Local Caching has been selected.
This setting will locally cache the data to help alleviate processing strain. This setting can then further be bolstered by increasing the allowed caching time qualified by Expiration Time or Size (if opting for the alternative value).
Should these options still not provide enough alleviation then the JDBC Lookup Stage also allows for multi-threading when local caching is enabled. The additional threads are used to help populate the cache and expedite the process. Once they have been used to populate the cache they are released back.
Given what we have reviewed above we can see just how quickly the total processing time of a table might increase based on certain factors. It is important to understand these calculations, and your data so that you can review expected processing times. Additionally, should those times become too cumbersome to review the steps provided to increase the efficiency of the stage.


