


Data Collector uses JMX metrics to generate the graphical display of the status of a running pipeline. You can provide the same JMX metrics to external tools if desired.
The following Java environment variables expose the Data Collector JMX metrics on a specified port, allowing integration with external tools:
- com.sun.management.jmxremote
- com.sun.management.jmxremote.port=<port_number>
- com.sun.management.jmxremote.local.only=<true | false>
- com.sun.management.jmxremote.authenticate=<true | false>
- com.sun.management.jmxremote.ssl=<true | false>
i.e
export SDC_JAVA_OPTS="-Dcom.sun.management.jmxremote \
-Dcom.sun.management.jmxremote.port=9999 \
-Dcom.sun.management.jmxremote.local.only=false \
-Dcom.sun.management.jmxremote.authenticate=false \
-Dcom.sun.management.jmxremote.ssl=false"
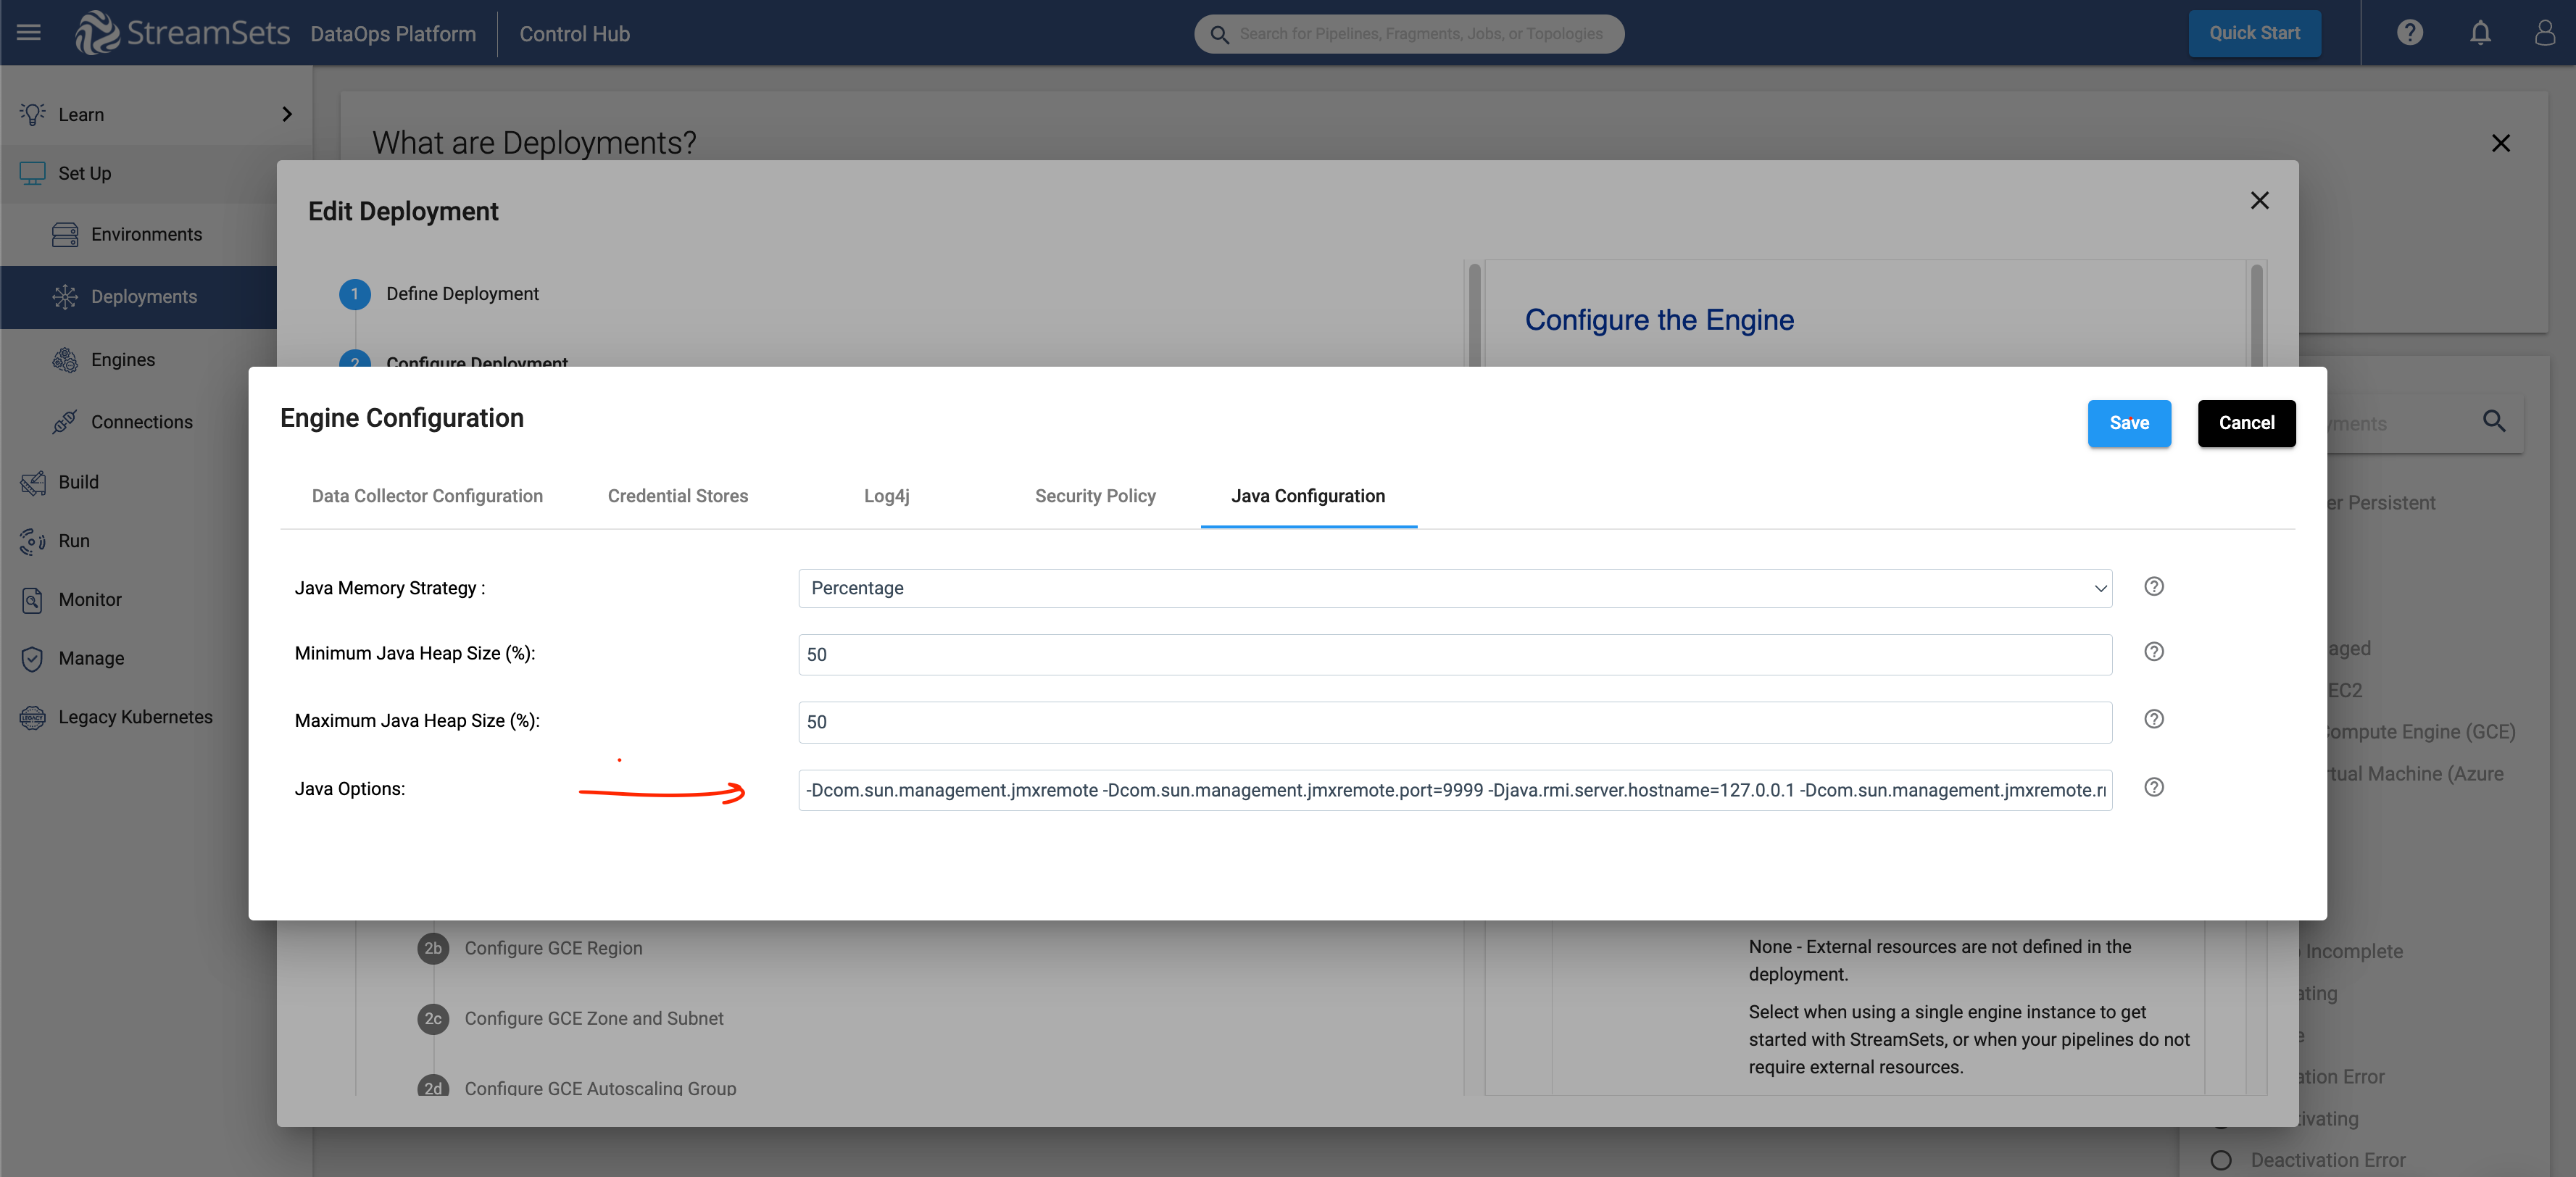
- Add the this Java argument to your SDC deployment
- For demo purpose I have used `jconsole` locally to collect this JMX metrix, However you can have any other external tools to collect this JMX metrics.
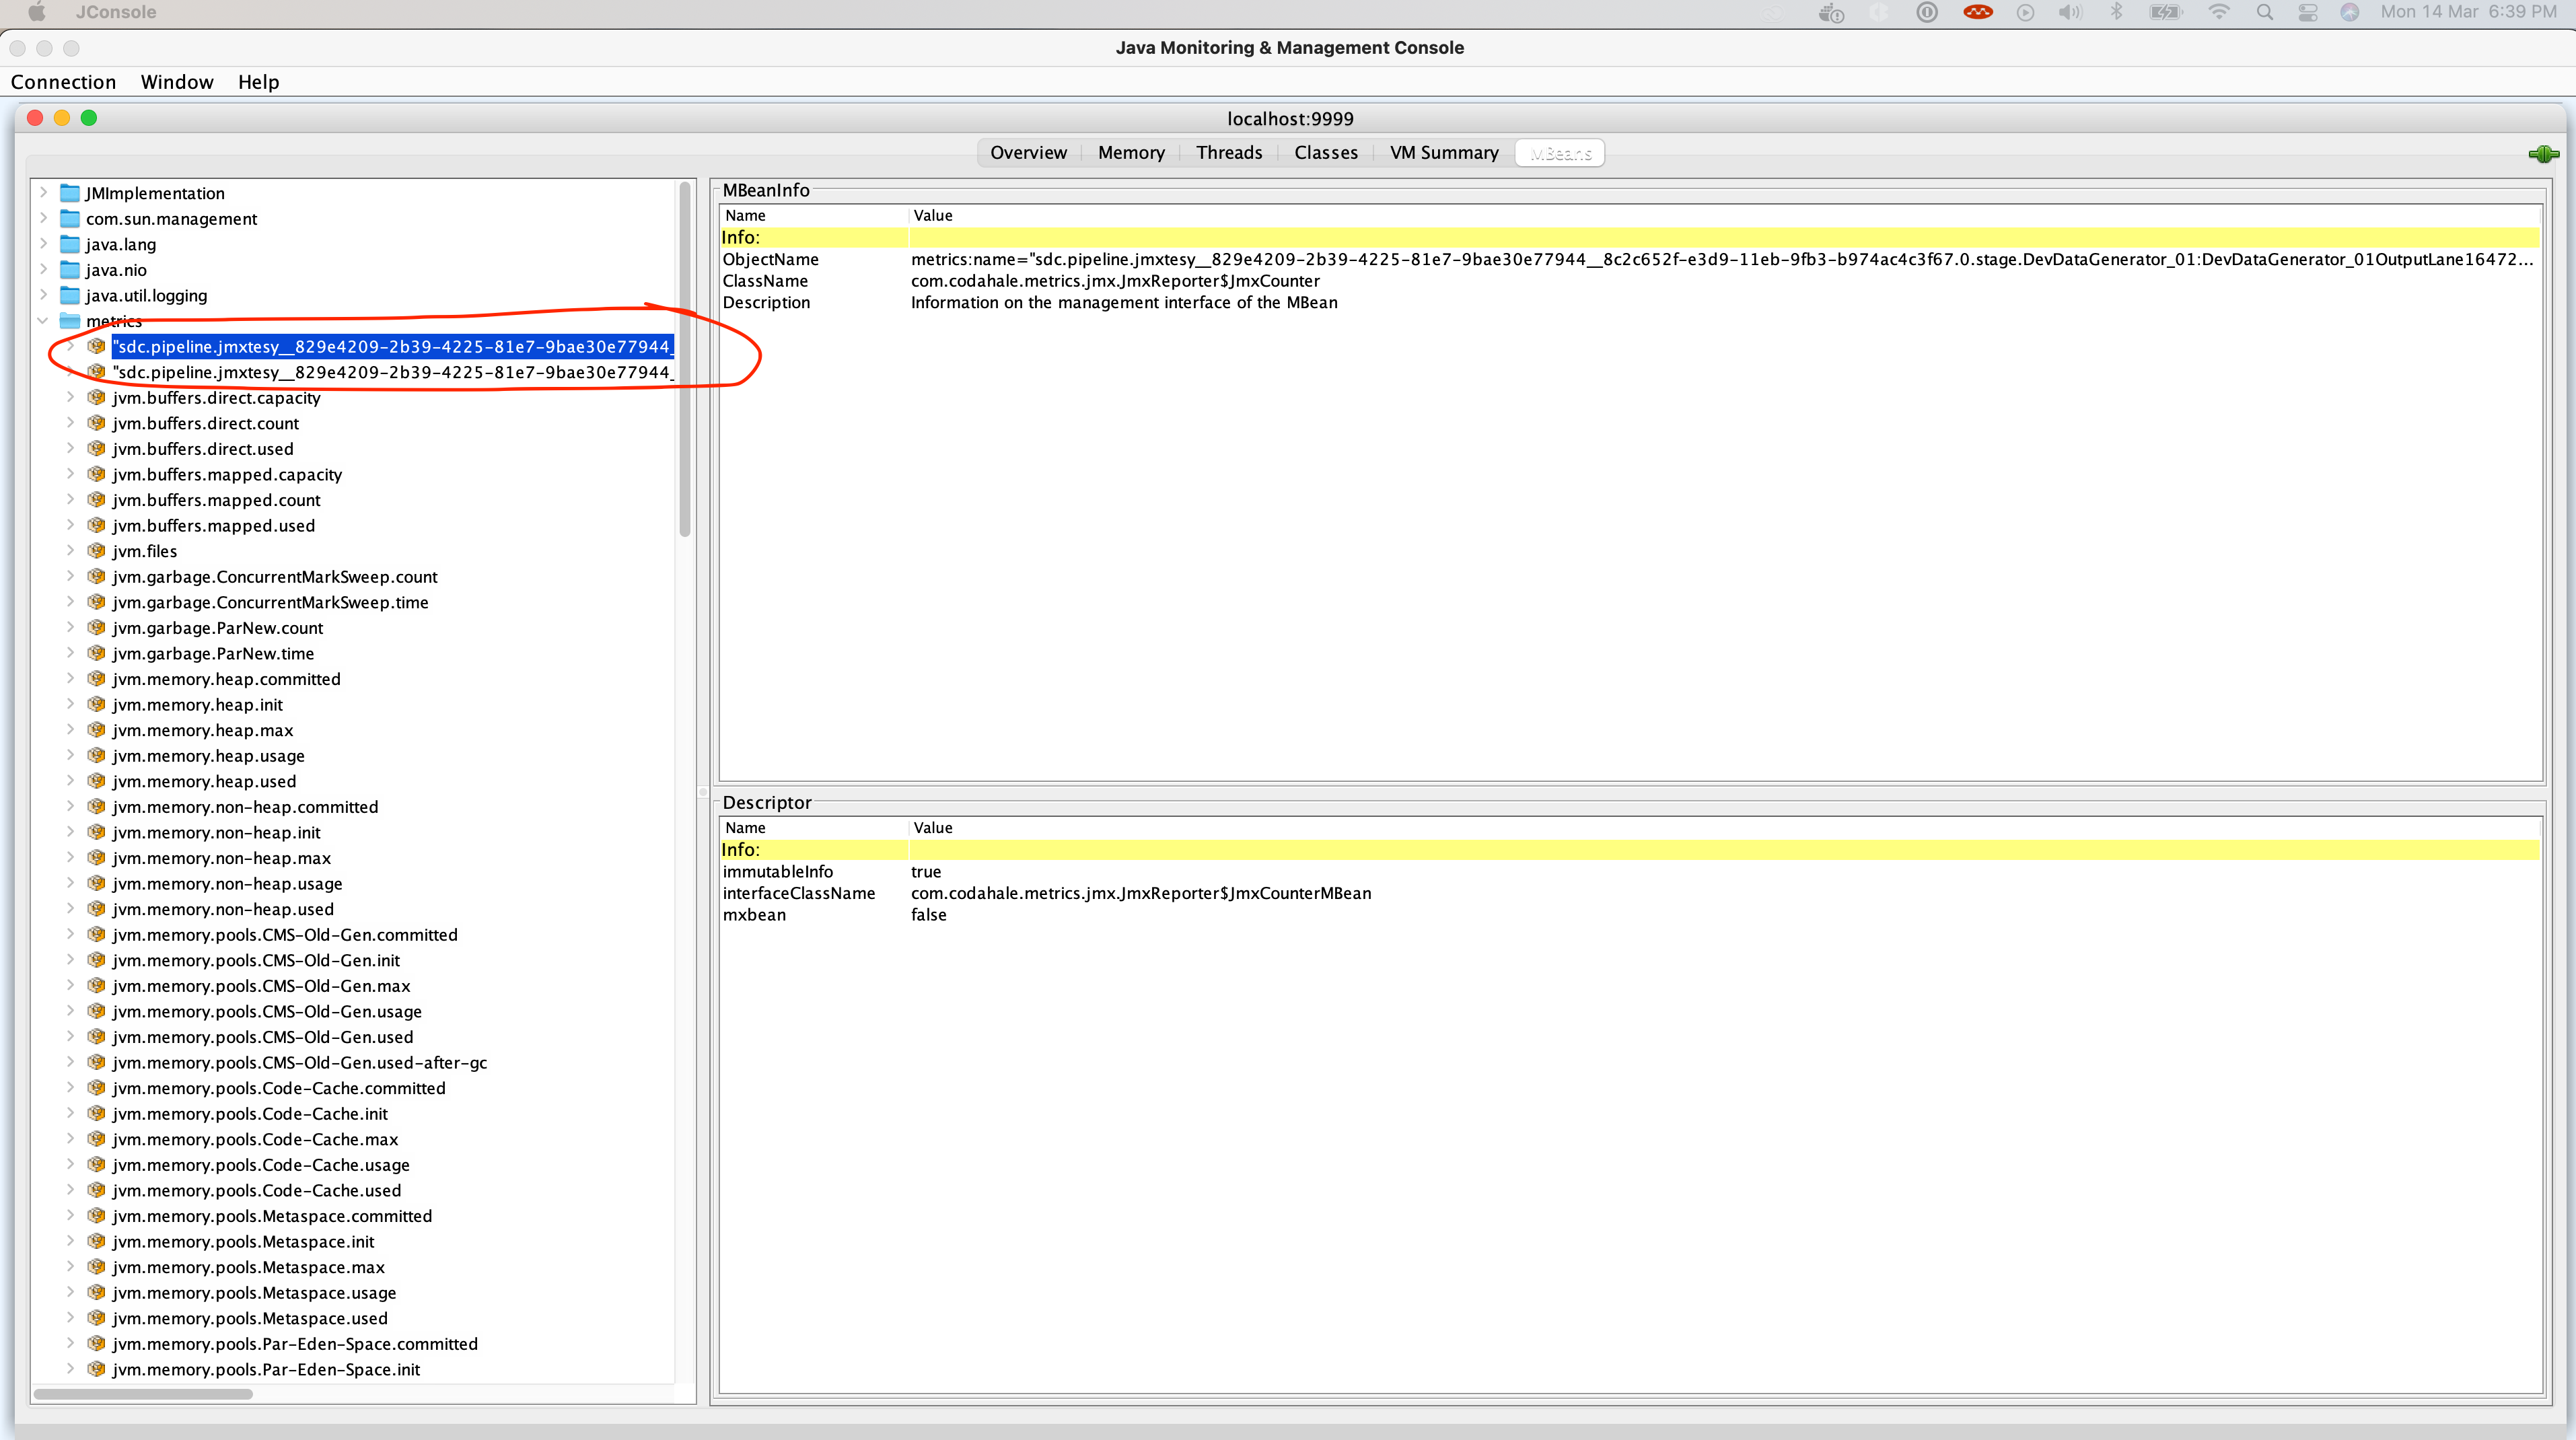
$jconsole localhost:9999-
You can view the Data Collector JMX metrics in external tools. The Data Collector JMX metric names all begin with "sdc.pipeline."
Data Collector JMX metrics use the following naming pattern:
sdc.pipeline.<pipeline name>.<pipeline revision>.<category: pipeline|stage|custom>.\
[<stage library>_<library revision>].<metric name>.<metric type>